Dashboard Monitors At Large
- Monitor the disposition of messages and alerts in real time
- Setup custom date/time/mailbox criteria for what you need to monitor
- View a summary of key document fields that trigger the monitor
Available Dashboard Monitors
- Alert Monitor: Shows you the number of your documents that failed to reach your partner due to an error condition.
- FA Monitor: This only operates on "EDI documents" that conform to ratified EDI standards, ANSI/X.12 or UN/EDIFACT and provides you the ability to see EDI documents that were acknowledged or not acknowledged with a Functional Acknowledgment transaction.
- Spacer: This is not an active monitor but rather a tool to assist you in laying out your monitors. As the Dashboard column containers mandate, the widgets stack from the top down, the spacer widget provides you with the ability to create some "space" between monitors if you wish to create groupings of them.
Dashboard Monitor Orientation
Some key concepts behind laying out and interacting with Dashboard Monitors on the Desktop-
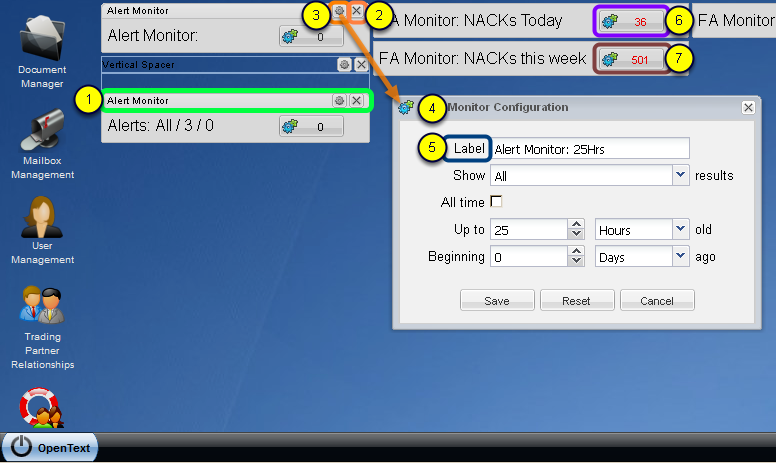
- Double-clicking anywhere on the Monitor panel aside from the button will toggle showing/hiding the Monitor panels Titlebar. The Widget is considered "pinned" when the titlebar is not showing; in "edit-mode" when the titlebar is visible. When a Widget is in edit-mode, you may drag and drop it to reposition its location. See the section titled "Another Example Layout" below for an example of drag and drop.
- The Titlebar contains an 'X' button. Click this to remove the Monitor from the Dashboard collection.
- The Titlebar also contains a gears icon. Click this to open the Monitor-specific Configuration window.
- Each of the various Dashboard Monitor's configuration panels contains fields specific to the needs of each Monitor. See the documentation for each Dashboard Monitor for details regarding the configuration field elements. The configuration window is modal to the entire application so no other interaction can be performed in the B2BMC until you click "Save" or "Cancel", which then results in the close of the window.
- One common field to all Dashboard Monitor Configuration windows is the Label field. When a monitor is created, the label is initialized with a generic string specific to each Monitor type. You may suffix your own descriptive text to what is already there, or you may completely replace the default with your own text. You should keep the text short and use abbreviations since a long label string will wrap to the next line out of view, so only part of the string will remain visible.
- The main objective of a Monitor is to provide a count of documents that match particular criteria; i.e. how many documents failed translation and were not delivered to your Trading Partner or how many documents were acknowledged or not acknowledged with a 997/Functional-Acknowledgment. That count is visible within the button. You may click the button to open a report, which displays the documents that matches the monitor's criteria. More on this topic can be found in each monitor's respective documentation page.
- The maximum number of records that can be displayed in the report pop-up window that opens as a result of clicking the numbered button is 500 records. If you see that a monitor displays 501, that means that "more than 500 records match this monitor's criteria". You should use the Document Managers advanced search and filter capabilities when you need to see more than 500 records that match the Monitor's criteria.
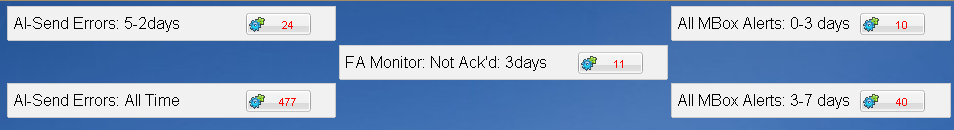
Example Layout:

The layout above illustrates a number of capabilities and configuration options
- All of the Widgets are "pinned", thus locked to the Dashboard and cannot be altered, moved or deleted unless double-clicked to put them into edit-mode.
- The Labels are all semantically worded to clearly describe what they are monitoring.
- One set of two Alert monitors are watching only one specific mailbox (annotated with "AI-Send"), the other two are monitoring all mailboxes.
- A Spacer is used in the right-most column to provide a visual separation between one of the sets of two Mailbox Alert Monitors from the other set of two Alert Monitors.
Another Example Layout

The above layout is merely an example. You can lay out your Dashboard Monitor in any way you prefer.
In this example the center Monitor is in the process of being positioned via a drag and drop action, highlighted in orange. The dotted-blue outline represents where the Monitor would be positioned if you were to drop it.
The image shown above is the way the Dashboard will look once the drag and drop is completed and the Monitor is double-clicked and pinned.
NOTE: Although only three columns are being used in the example images above the Dashboard layout you can use consists of four columns of Widgets.