Alert Monitor
- Shows you the number of documents that failed to reach your partner due to an error condition.
- This Monitor will watch and report on data transmission errors in your Outbox.
Configure the Alert Monitor

It is expected that you have already acquainted yourself with the two introductory Monitor pages, Monitors At Large and the Monitor Chooser. If you have not, please do so now to learn how we reached this point.
After double-clicking the monitor to put it into edit-mode, click the 'gear' icon [highlighted in green] to open the configuration window [highlighted in orange].
Alert Monitor Configuration's field descriptions:
- Label - The previous pages mention this field several times. When a monitor is created the label is initialized with a generic string specific to each Monitor type. You may suffix your own short descriptive text to the default already there, or you may completely replace the default with your own text. You should keep the text short and use abbreviations, as a long label string will wrap to the next line out of view so only part of the string will remain visible, and also be semantically descriptive to represent the way the monitor is configured. This example suffixed the default label with "All Mbox / 1day - 1hr" to describe the configuration options; you can remove or change the default label text as well.
- Show - A value of "All" will watch and report-on All mailboxes your Login ID has access to. If you click the down-arrow, all the Mailboxes you can access are listed. It is recommended if you change this monitor to watch for only one Mailbox ID, you should modify the Label to include that.
- All Time - This sets the overall Date/Time range that this widget will watch and report on records in error. You may provide a date criteria based on Day, Hours or Minutes back. The maximum period you may select to monitor is seven (7) Days, regardless of whether you state that in Days, Hours or Minutes.
- Up to # Days|Hours|Minutes old - This sets the overall Date/Time range that this widget will watch and report-on records in error. You may provide a date criteria based on Day, Hours or Minutes back. The maximum period you may select to monitor is 7 Days, regardless of whether you state that in Days, Hours or Minutes.
- Beginning # Days|Hours|Minutes ago - This sets a Date/Time range to skip and exclude from the report. Exactly as the previous field operates, you may provide a date criteria based on Day, Hours or Minutes back. The maximum period you may select to skip is seven (7) Days, regardless of whether you state that in Days, Hours or Minutes.
The example above is Labeled as "Alerts: All Mbox / 1day - 1hr" to fit into the space available:
- Removing the symbols that would read as "Alerts: All Mailbox for 1 day minus 1 hour".
- The unabbreviated version of that would read as "All Mailbox Alerts for Today, but defer reporting until a failed document transmission is at least 1 hour old".
In detail...
- "Show" is set to watch and report-on "All" mailboxes
- The "Up to ... old" criteria is using the "Days" mode set to "1 day", which can also be described as "Today".
- And the "Beginning ... ago" -- which again is a criteria that skips the reporting of matching records for a date/time range starting from the present -- is using the "Hours" mode set to "1 hour".
Open the Alert Report
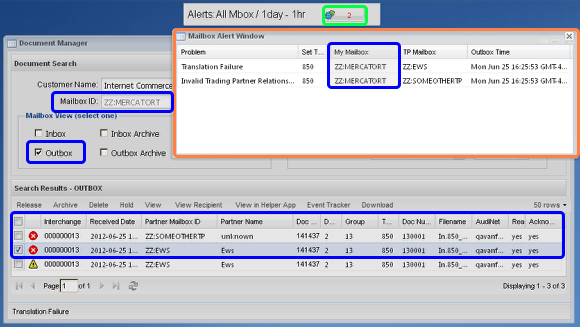
- When the Monitor's record count is greater than zero [highlighted in green], you may click the button to see a report of the records that match the Monitor's criteria [highlighted in orange].
- Refer to the Outbox of the Mailbox you see in the "My Mailbox" column in the Document Manager to locate the actual failed documents. [highlighted in blue]
- Clicking on the document in the Document Manager shows the reason for the failure in the Status bar. If a transaction has multiple issues, all will be shown with a pipe'(|)' separating the reason strings.
- You can view the document to help determine why it failed. Common failures are shown above: A Trading Partner Relationship does not exist, or the Translation failed.
- NOTE: You see three records above in the Document Manager, but you only see two records in the Alert Monitor's report window. This is because the third transmission was restored from the Outbox Archive. Restored transmissions are placed "On-Hold" in the Outbox. Thus, that transmission, which happens to be a binary copy of the second transmission, has not actually failed yet because it has not been Released from the Outbox and retransmitted to the Receiving Partner.
Note about the Alert Count: The maximum number of records that can be returned to the Alert Monitor or its report window is limited to 500. If you see the count read 501 that implies that you have "more than 500" failed records. The actual number of records can be determined from the Outbox.
